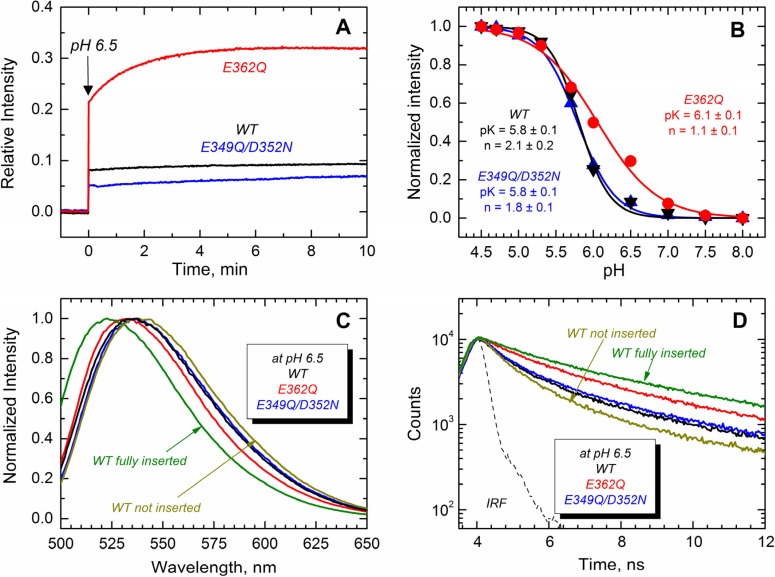
Figure 8.
Transmembrane insertion of the TH8–TH9 hairpin into 75POPG/25POPC LUV measured at different pHs for the T domain WT (black) and the mutants E362Q (red) and E349Q/D352N (blue). (A) Kinetics of insertion of the NBD-labeled T domain at residue N366C showing a more efficient insertion of the mutant E362Q at pH 6.5; (B) Normalized NBD intensity at 523 nm for the T domain WT and mutant upon mixture with LUV and equilibration at the indicated pH. The apparent pK and the cooperativity factor n were estimated by fitting the data as previously described [35]; (C) Normalized emission spectra of the data of (A) at the end of the kinetics showing a blue-shift in the position of maximum emission for the mutant E362Q (λmax of the spectra are 536 nm, 536 nm and 531 nm for WT, E349Q/D352N and E362Q, respectively; λmax of reference spectra are 536 nm and 523 nm for the non-inserted and fully-inserted WT T domain); (D) Fluorescence lifetime of the data of (A) at the end of the kinetics of insertion showing longer fluorescence decay for the mutant E362Q (average τ values for decays are 1.5 ns, 1.7 ns and 2.5 ns for WT, E349Q/D352N and E362Q, respectively; average τ values for reference decays are 1.2 ns and 3.3 ns for the non-inserted and fully-inserted WT T domain, respectively). The instrument response function (IRF) was used for the deconvolution of the data. Data for a non-inserted and fully-inserted WT T domain were measured at pH 8.0 and pH 5.3, respectively.

