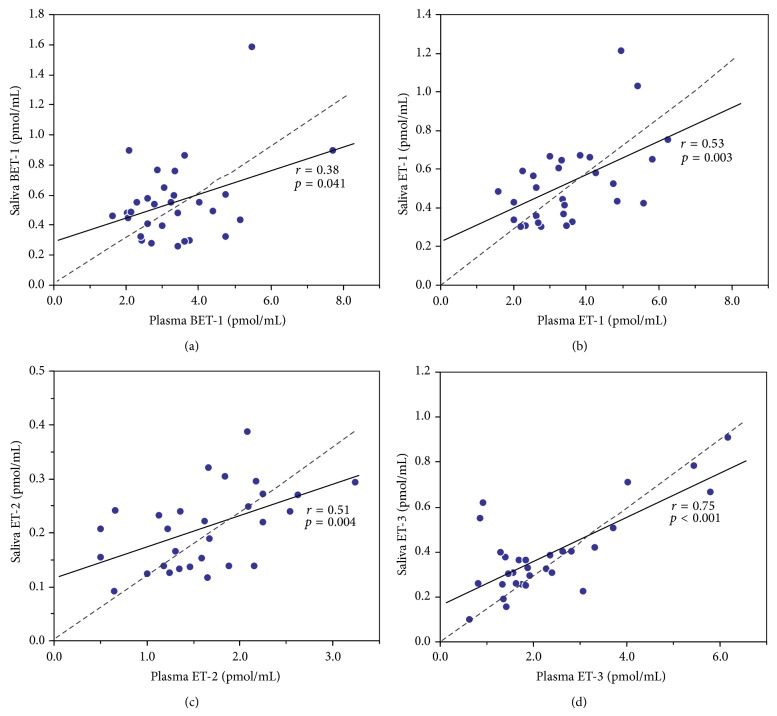
Figure 2.
Correlation between endothelin isoforms BET-1 (a), ET-1 (b), ET-2 (c), and ET-3 (d) in plasma and saliva of male subjects (n = 30) measured by HPLC-fluorescence. Assuming simple linearity, the linear regression (solid line) intercept on saliva axis is an estimate of salivary gland endothelin production (r and p values indicated). The linear regression forced through zero (dashed line) assumes diffusion of endothelins entirely from plasma.

