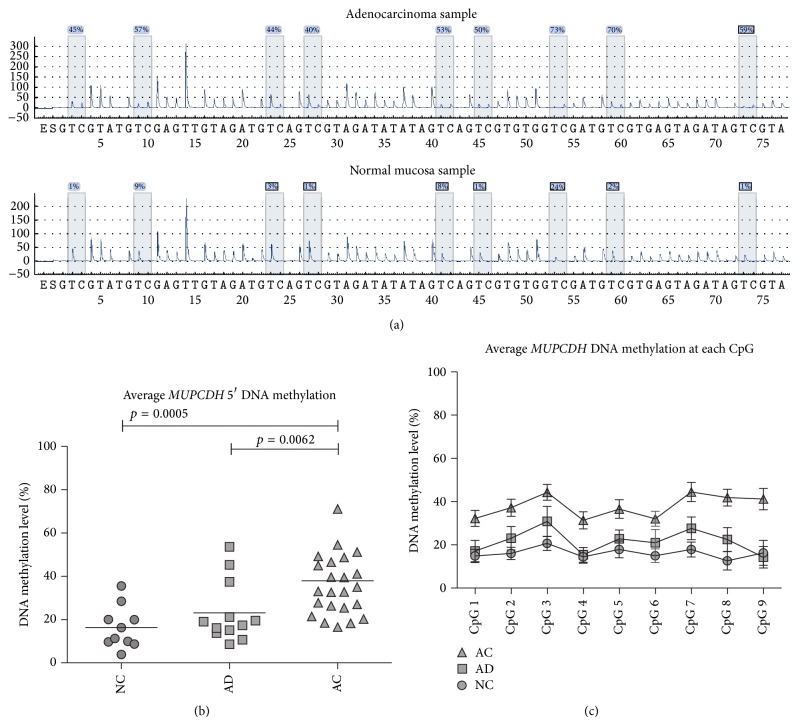
Figure 3.
MUPCDH promoter DNA methylation results. (a) The examples of pyrosequencing results for individual adenocarcinoma and normal mucosa samples. (b) The average MUPCDH promoter DNA methylation in normal colonic mucosa (NC), adenomas (AD), and carcinoma (AC) samples. (c) The average DNA methylation level at each of the analysed CpG positions. Horizontal lines on graph indicate mean values and standard error of the mean.

