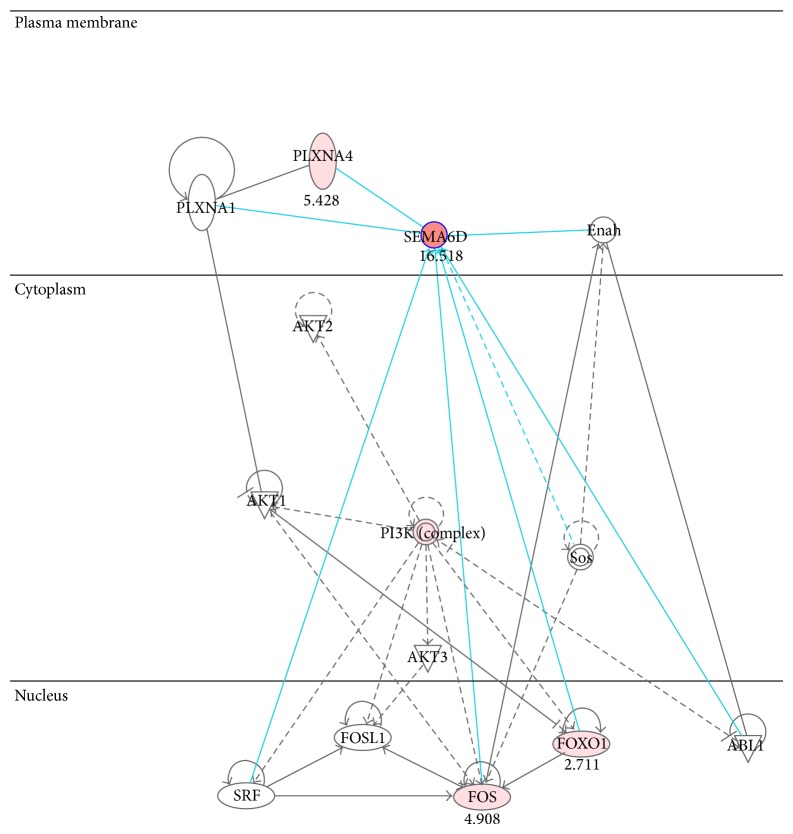
Figure 4.
Activation of SEMA6D and transcription. The gene-gene interaction network was built based on direct interactions by using Ingenuity Pathway Analysis (IPA) suite. Color indicates increased (in red) expression when SEMA6D-high samples were compared with SEMA6D-low samples. The number indicated the fold changes of this comparison.

