
Figure 1.
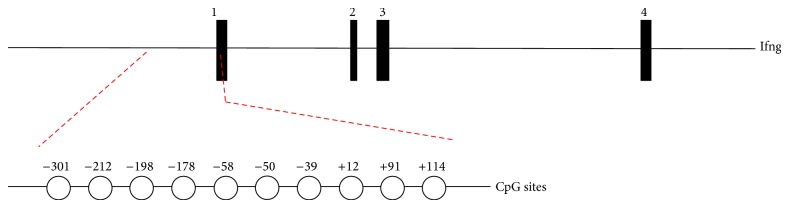
Schematic view of mouse interferon-γ locus (Ifng). Exons are shown as black boxes. In detail, the relative positions of the CpG sites located at the Ifng promoter are indicated. The numbers correspond to their distance relative to the transcription start site (+1) of the Ifng.