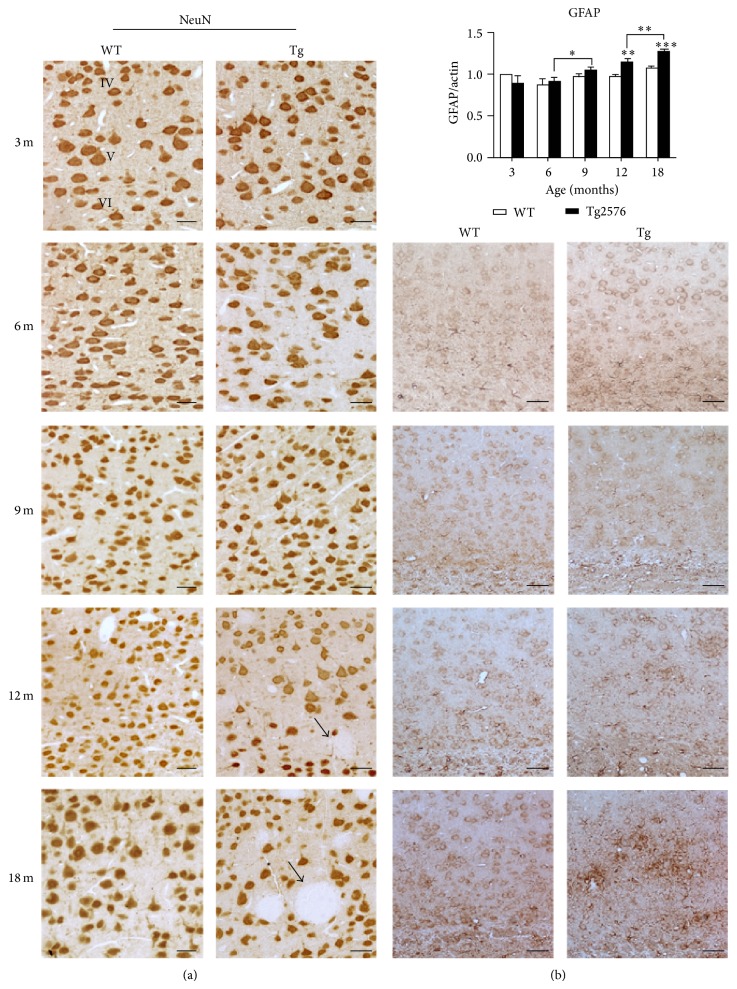
Figure 1.
NeuN and GFAP expression in the neocortex of WT and Tg mice. (a) NeuN IHC localization in the neocortex of 3-, 6-, 9-, 12-, and 18-month-old WT and Tg mice. Arrows indicate amyloid plaques in 12- and 18-month-old mice. Scale bars, 40 μm. (b) Upper picture, GFAP WB densitometric analysis on neocortex protein extracts of 3-, 6-, 9-, 12-, and 18-month-old mice. Values are expressed as mean ± SD. ∗∗ P < 0.01; ∗∗∗ P < 0.001. (b) Lower pictures, GFAP IHC distribution in 6-, 9-, 12-, and 18-month-old WT and Tg neocortex. Scale bars, 60 μm.

