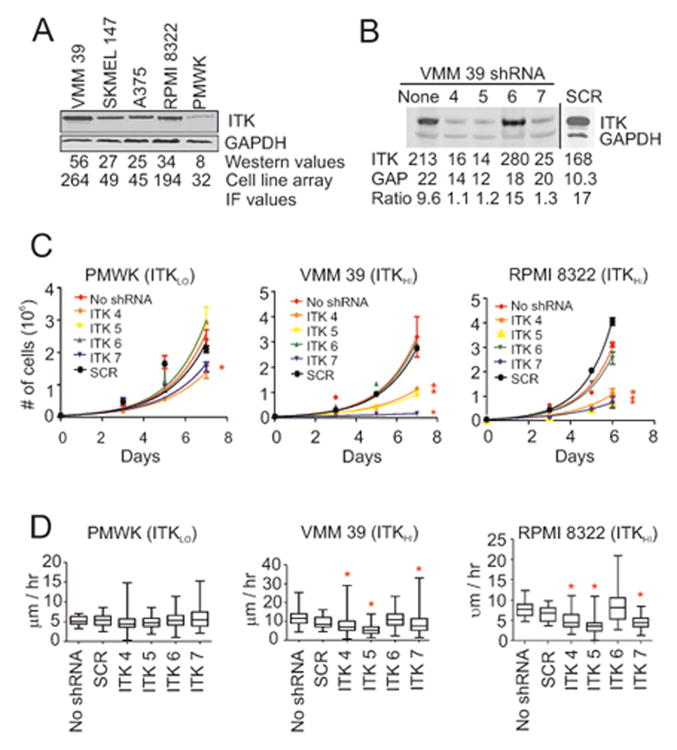
Figure 2.

ITK Expression in melanoma cell lines and effects of ITK depletion on their proliferation and motility. (A) Western blot analysis for total ITK in whole cell protein lysates obtained from five melanoma cell lines. Signal intensities of the protein bands were normalized to GAPDH. Cell array IF values from Supplementary Table S3 are also shown for comparison. (B) Western blot analysis for total ITK in protein lysates obtained from VMM 39 melanoma cells that were transduced with shRNA sequences designed to target ITK mRNA (ITK 4, 5, 6, and 7) and with scrambled (SCR) shRNA. The integrated values of ITK containing bands shown in the figure were normalized against the GAPDH values to produce the ratio shown in the figure. (C) Effects of the five shRNAs on the proliferation rates of PMWK, VMM 39 and RPMI 8322 melanoma cells. Asterisks denote melanoma cell lines whose proliferation was significantly reduced compared to SCR shRNA (P < 0.05, Bonferroni corrected; Supplementary Table S4A). (D) Single-cell motility analysis of PMWK, VMM 39 and RPMI 8322 cells transduced with various shRNAs. Asterisks denote significant changes in motility compared to SCR shRNA (P < 0.05, Bonferroni corrected; Supplementary Table S4B).
