
Figure 4.
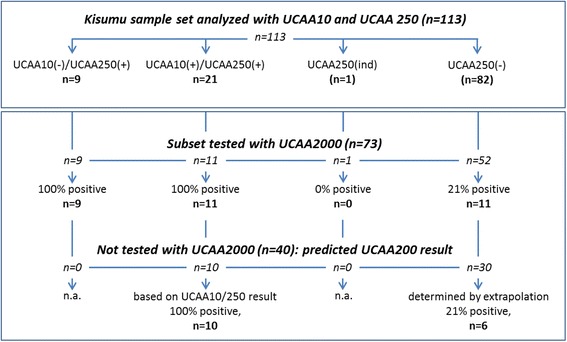
Expected qualitative UCAA2000 test results for samples tested with UCAA10 and UCAA250. The Kisumu sample set (n = 113) was tested with both the UCAA10 and UCAA250 assay. Only a non-random subset (n = 73; selection based on UCAA10/250 results) was tested with the UCAA2000 assay. The subset included 52 samples with a negative UCAA250 result. Ten samples with a positive test result for both UCAA10 and UCAA250, plus 30 samples with a negative test result for the UCAA250 were excluded. Extrapolation: for the 30 negatives, the same percentage of positives (21%) was assumed as empirically determined for the 52 negatives tested with the UCAA2000 assay. Numbers between brackets indicate samples with a negative test result; (+) and (−) following the UCAA assay indicate a positive or negative test result, respectively.