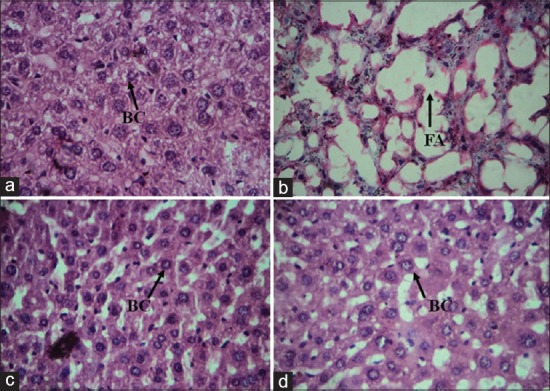
Figure 6.

Microscopic evaluation of hepatic tissue (a) control showing normal hepatocytes, (b) diethyl nitrosamine (DEN) treated group showing high accumulation of fat with in the hepatocytes, (c) DEN + Cynodon dactylon 50 mg/kg treated group and (d) DEN + tamoxifen 20 mg/kg treated groups showing recovery of normal hepatocytes (H and E, ×400). FA = Fat accumulation, BC = Binucleated cells
