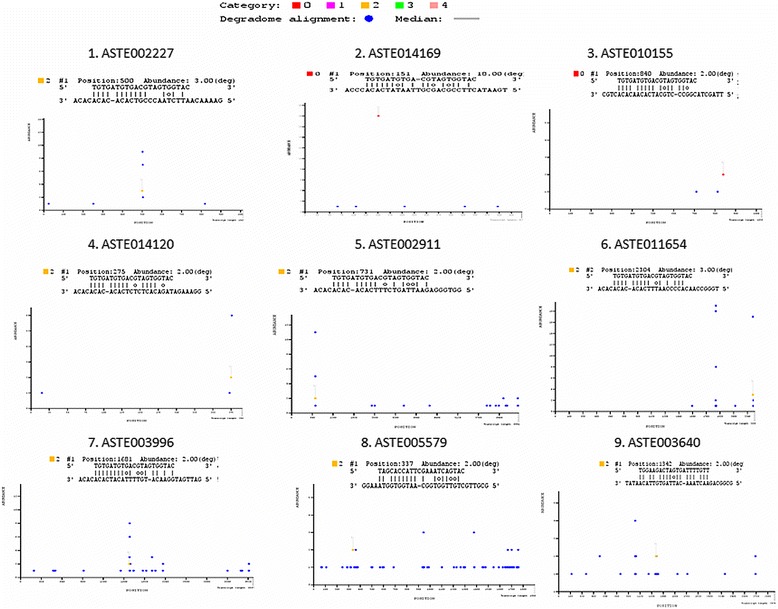
Figure 5.

miRNA targets identification by Degradome sequencing. T-plots of miRNA targets classified under category 2, 1 and 0. X-axis represents transcript length whereas Y-axis represents number of degradome read that were mapped on to specific position on the target sequence. Blue dot depicts position on the transcript where degraded read was mapped. Coloured dots represent the position on the transcript where degraded fragment (s) and miRNA seed sequence mapped on the transcript.
