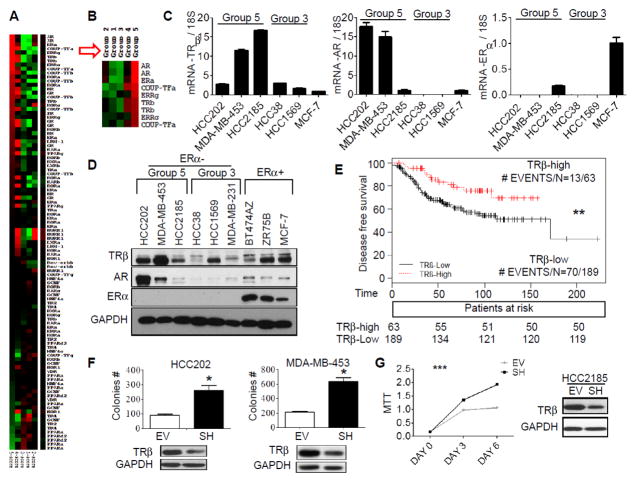
Figure 1. Low TRβ levels are associated with worse DFS and enhanced cell proliferation.
A. Heatmap showing comparison of NR gene expression among five patient groups using Cluster 3.0 and TreeView. The comparison was calculated based on relative NR gene expression. Red or green color indicates relatively high or low expression respectively, compared to other groups, and black indicates average expression. Some genes were recognized by multiple Affymetric probes. B. The most differentially-overexpressed genes in group 5 are shown. C. qRT-PCR was performed to evaluate the gene expression of TRβ, AR and ERα in group 5 representative cell lines HCC202, MDA-MB-453, and HCC2185. 18S RNA was used as a loading control. Group 3 representative cell lines HCC38 and HCC1569 were used as negative controls. MCF-7 gene amplification cycles were used as the reference to calculate fold change. D. TRβ, AR, and ERα protein expression was examined using western blot analysis in group 5, group 3, and ER positive breast cancer cell lines. GAPDH was used as loading control. E. Kaplan-Meier plot of TRβ using Sabatier et al. [34] (**p<0.01). Data represent an average of 3 Affymetric TRβ probesets, and 75th percentile was used as the cut-point to separate patients into two outcome groups. F. HCC202 and MDA-MB-453 cells were stable transfected with empty vector (EV) or TRβ shRNA (SH) plasmid and TRβ expression was evaluated by western blot, and soft agar. Results represent the average ± SD of three experiments normalized to respective EV (* p<0.05). G. HCC2185 EV and SH cells were analyzed for TRβ expression using western blot analysis and growth in MTT assays using GraphPad Prism 5 (***P<0.001 SH cells growth curve compared to EV).

