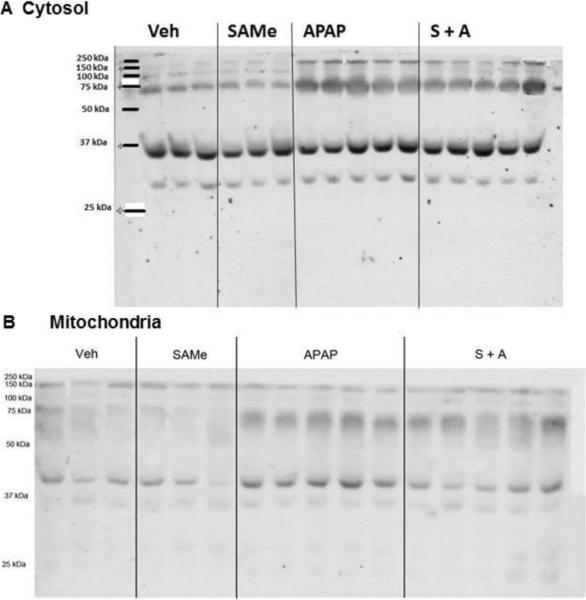
Figure 4. Western analysis of cytosolic and mitochondrial fractions 4 h after APAP treatment.
Treatment groups were as described in Figure 1. Liver cytosol and mitochondrial fractions were prepared from liver samples 2 and 4 h post APAP administration. A 100 ug aliquot of protein was loaded in each lane and a 1:1000 primary Anti-4-HNE Michael adduct antibody was used to assess 4-HNE adduction. Representative gels for cytosol (Panel A) and mitochondria (Panel B) are shown for the 4 h post APAP treatment time. Densitometry results are shown in Figure 5.

