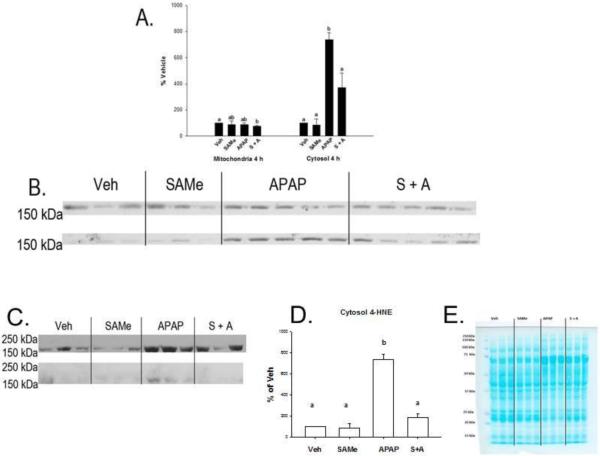
Figure 7. Mitochondrial and cytosolic fraction CPS-1 expression 4 h following APAP overdose.
Treatment groups were as described in Figure 1. Panel A contains the densitometry for mitochondrial and cytosolic CPS-1 Western blots. Panel B depicts mitochondrial (upper gel) and cytosolic (lower gel) probed for CPS-1. Panel C denotes 4-HNE binding of western blot band which was positive for CPS-1. The upper row depicts mitochondria and the lower bands depict cytosolic. Panel D depicts densitometry analysis for cytosolic 4-HNE adduction. Densitometry was normalized to total protein lane staining. Panel E depicts cytosolic protein gel staining. Values represent mean ± S.E.M. with n=3-5 mice per group. Groups with a different superscript letter (a, b or c) are statistically different (p<0.05).

