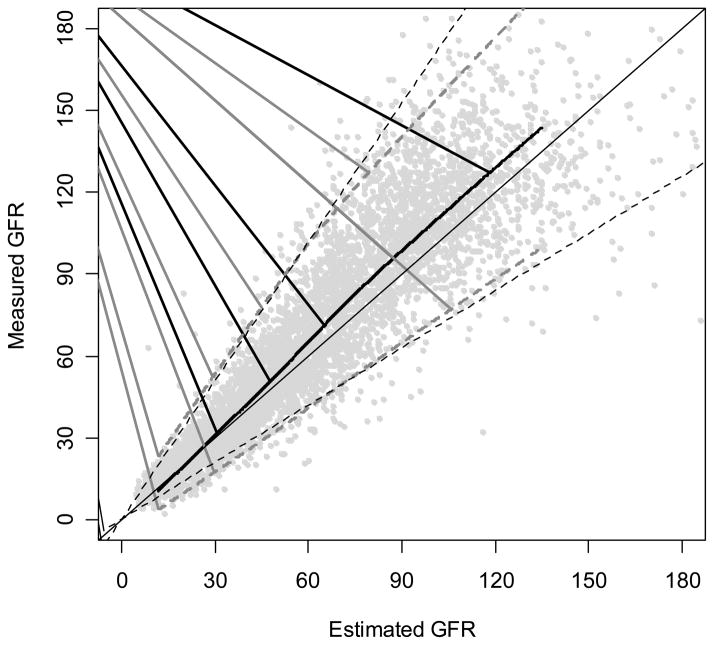
Figure 1. Comparison of MDRD Study Equations to Measured GFR.
Solid horizontal line is the line of identity. Black curved line is a smooth curve through the points and was created using 95% of the data. Dashed grey lines are quantile regressions of the 5th and 90th percentiles of the differences which measures precision. The grey dotted vertical line indicates 30% errors [45].

