
Extended Data Figure 2. Location of BLA projectors recorded and analyzed for each experimental group of Figure 1.
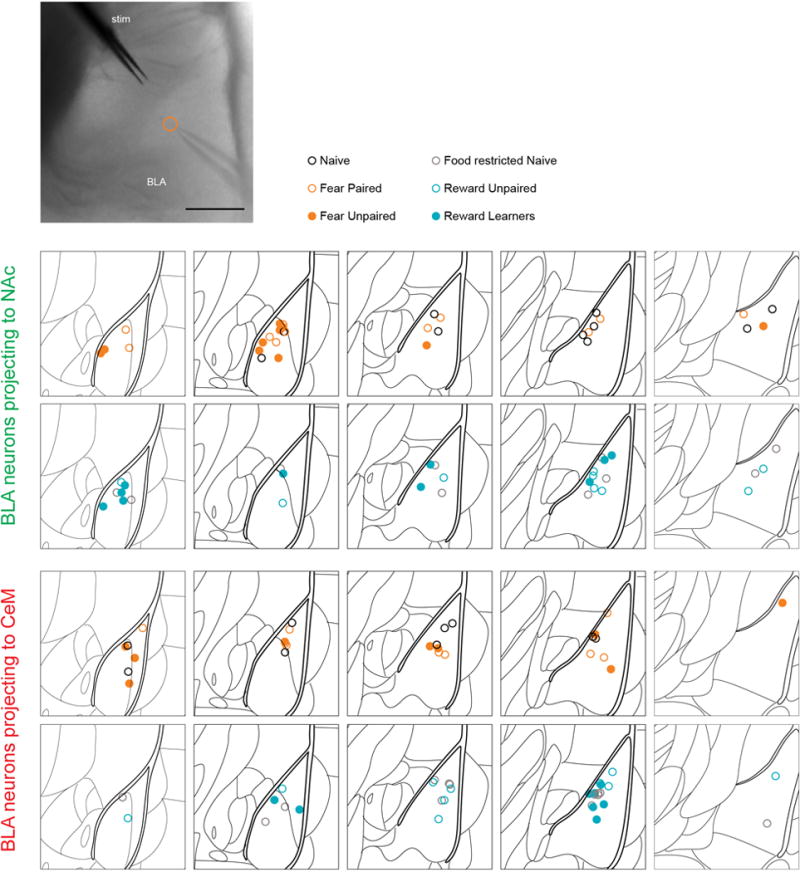
Top, Representative DIC image showing the location of the stimulation electrode around a bundle of fibers of the internal capsule and a neuron recorded in the BLA (at the tip of the micropipette). The location of the recorded cell is indicated by an orange open circle. Scale bar reflects 200 μm. Bottom, Atlas schematics (1.5 mm × 1.5 mm) showing BLA at various antero-posterior (AP) positions relative to Bregma. Each circle represents the location of a neuron from which AMPDAR/NMDAR ratio was acquired (Figure 1). NAc projector locations are summarized in rows 1 and 2 and CeM projector locations are summarized in rows 3 and 4. Color of the circle represents the conditioning group of the animal from which AMPDAR/NMDAR ratio was acquired.