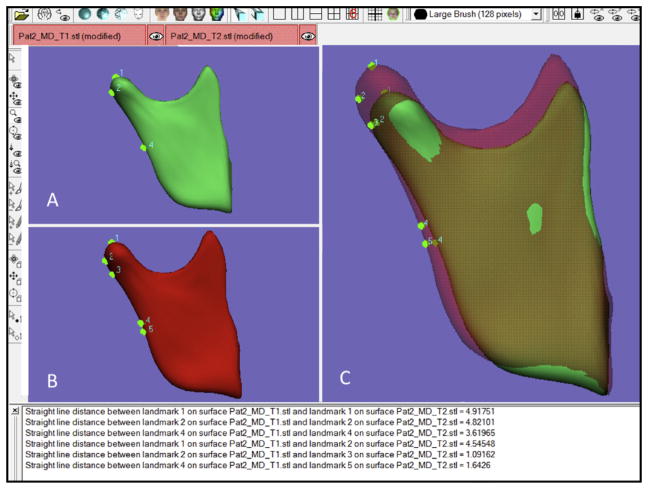
Fig 3.
Two-dimensional figure showing the distances between landmarks placed in the T1 and T2 surface models registered using the mandible as the reference. The distances between landmarks can be automatically calculated by different methods: closest point and corresponding (homologous) point. The distances between landmarks are displayed. Points 1 (most superior point in the condyle), 2 (most posterior point in the condyle), and 4 (point in the mid-distance between gonion and point 1) located on the T1 surface model (green) have corresponding points in the T2 surface model (red). Note in the overlay that the closest points for points 1, 2, and 4 in the T1 surface model are points 2, 3, and 5 placed over the T2 surface. Comparing the distances between corresponding points (1–1, 4.92 mm; 2–2, 4.82 mm; 4–4, 3.62 mm) to the closest points (1–2, 4.54 mm; 2–3, 1.09 mm; 4–5, 1.64 mm), it is notable that the distance between the 2 closest points placed over the 2 models is often smaller than the corresponding points’ distance.

