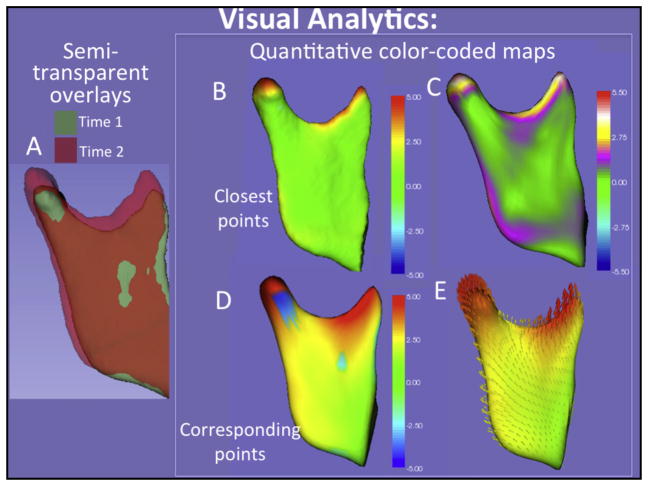
Fig 4.
Two-dimensional figure showing: A, the right mandibular ramus and condyle semitransparent overlay, and B–E, quantitative color-coded maps of the distances measured in Figure 3. In B–E, 2 types of color-coded maps are shown: the closest distances between surface points are shown with 5 colors in B and with 7 colors in C to better define the regional measurements; the distances between corresponding points in the surface models are shown in D, and the vectors of the growth direction are shown in E.

