. 2015 Apr-Jun;37(2):138–143. doi: 10.4103/0253-7176.155610
Copyright: © Indian Journal of Psychological Medicine
This is an open-access article distributed under the terms of the Creative Commons Attribution-Noncommercial-Share Alike 3.0 Unported, which permits unrestricted use, distribution, and reproduction in any medium, provided the original work is properly cited.
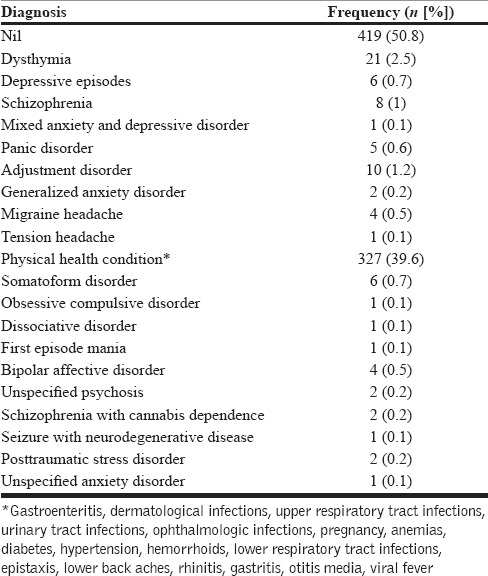
Table 1.
Distribution of the diagnoses in the entire sample (n = 825)

