
Figure 3.
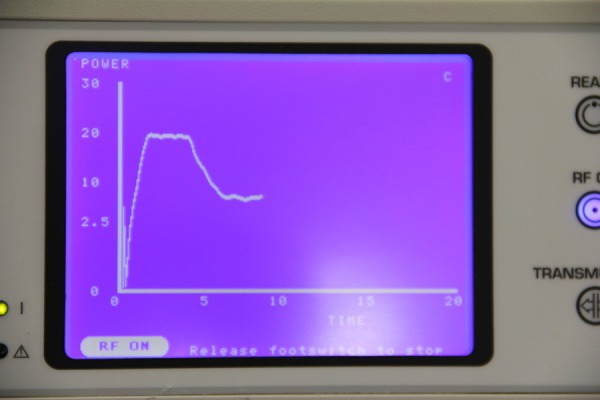
During the ablation cycle a graph of tissue conductance (current/voltage) versus time is displayed on the ablation and sensing unit (ASU) monitor (AtriCure, Inc., Ohio, USA).
Official websites use .gov
A
.gov website belongs to an official
government organization in the United States.
Secure .gov websites use HTTPS
A lock (
) or https:// means you've safely
connected to the .gov website. Share sensitive
information only on official, secure websites.
During the ablation cycle a graph of tissue conductance (current/voltage) versus time is displayed on the ablation and sensing unit (ASU) monitor (AtriCure, Inc., Ohio, USA).