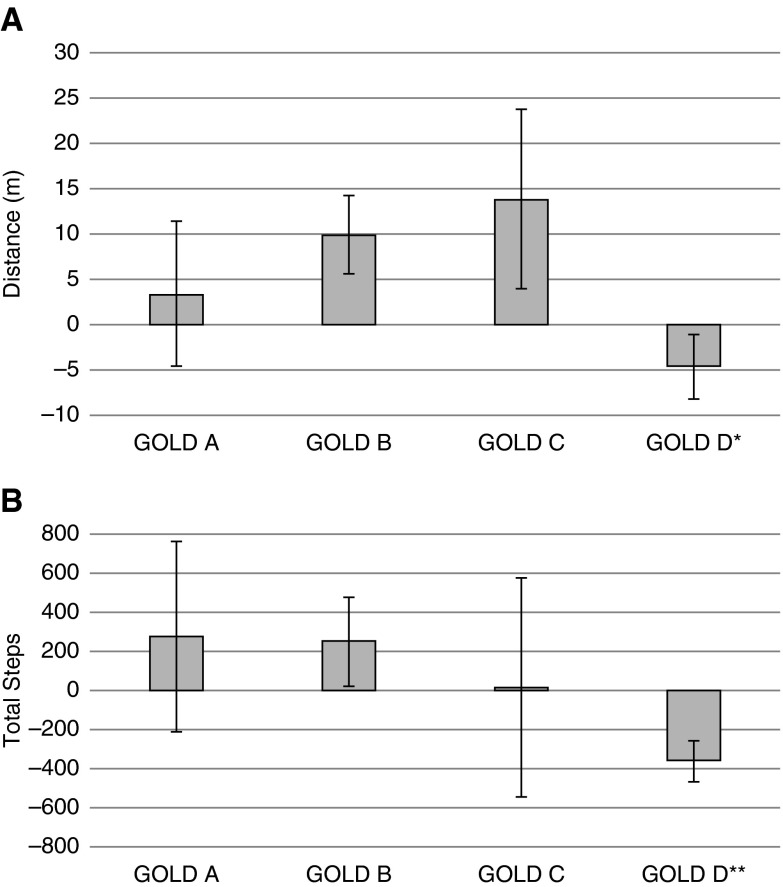
Figure 1.
Changes in exercise tolerance and daily physical activity. Bars represent mean changes in (A) 6-minute-walk distance, and (B) total daily accelerometry steps over 16 weeks, by Global Initiative for Chronic Obstructive Lung Disease (GOLD) 2011 group. Vertical brackets represent SEM changes. *P < 0.05 for pairwise comparison of change in group D versus B. **P < 0.05 for pairwise comparisons of change in group D versus all other groups.

