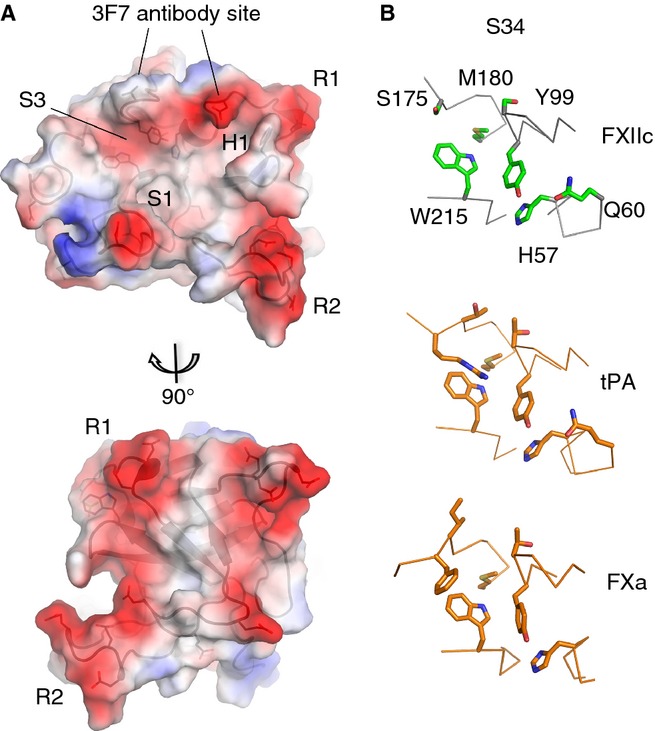
Fig 4.

FXIIc surface pockets and charge. (A) Charge surface representation of the FXIIc crystal structure (negative = red and positive = blue). Ridges of negative charge are labeled R1 and R2. S1, S34 and H1 pockets are labeled. Two views related by a 90° rotation are shown. (B) Zoom-in view of the S34 pocket structure for FXIIc (top), with side chains shown as sticks (green) and equivalent residues shown for tissue-type plasminogen activator (t-PA) (middle) and FXa (bottom) colored orange.
