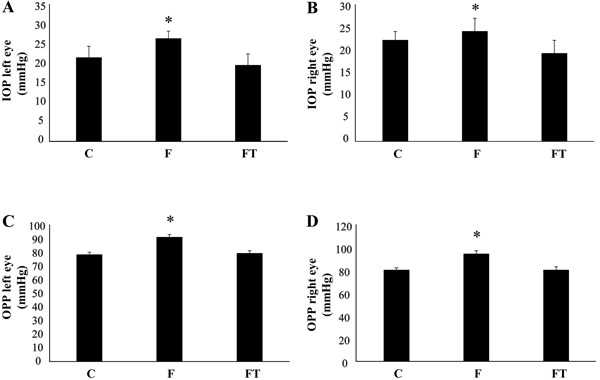
Figure 1. Intraocular pressure (IOP) and ocular perfusion pressure (OPP) in the left (A and C) and right (B and D) eyes. Data are reported as means±SE. F: sedentary fructose; FT: trained fructose. *P<0.05 vs sedentary control (C) (one-way ANOVA followed by Student-Newman-Keuls post-test).

