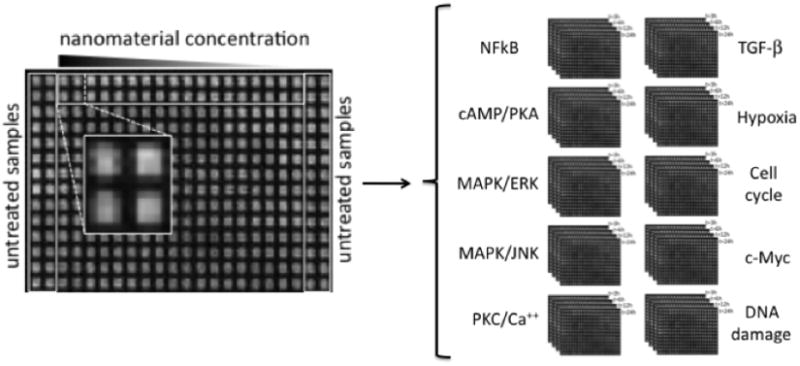
Figure 1.

Depiction of the experimental set-up for the HTS assay and the data generation. Layout of a 384-well HTS plate (left) showing the location of untreated samples (i.e., cell not exposed to eNMs) and the four replicate wells for each nanoparticle concentration. Four different plates were employed to measure the activity of each of the 10 pathways (right) at different exposure times (3, 6, 12 and 24 h).
