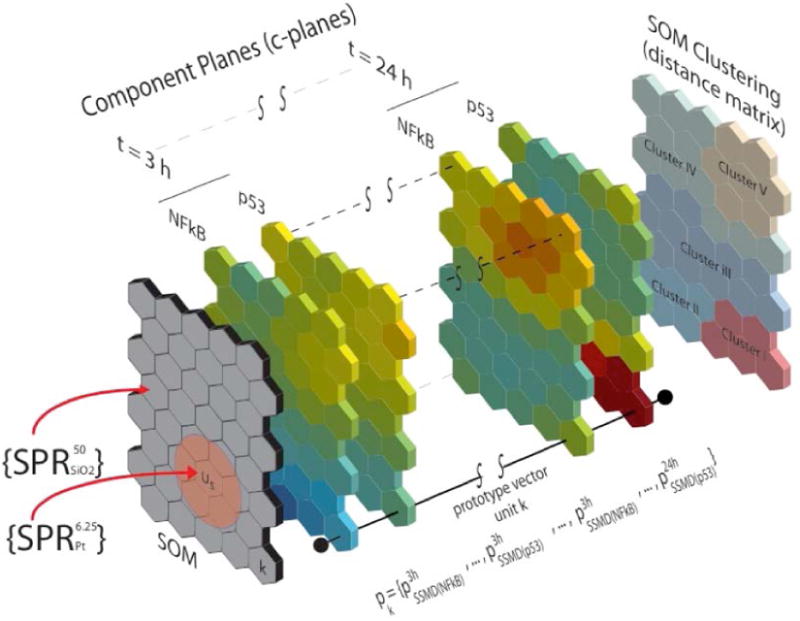
Figure 2.

Structure and principal elements of the SOM used the current work. The gray plane (left) represents the SOM grid composed by 40 units arranged in a hexagonal configuration of 8×5 units. Subsequent color slices correspond to the visualization of each of the 40 component planes (c-planes) corresponding to each signaling pathway at each exposure time (3 h – 24 h). The plane on the right side depicts the clustering of similar SOM units based on the distance matrix.
