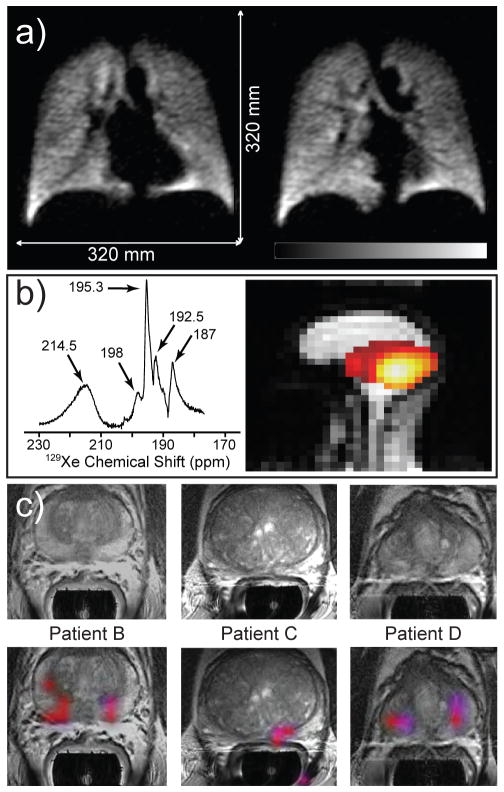
Figure 5.
Examples of biomedical use of hyperpolarized contrast agents in human subjects for pulmonary functional imaging,[5b] spectroscopy and imaging of brain uptake of 129Xe,[79] and molecular imaging of prostate cancer.[27] a) Two slices selected from a 3D 129Xe GRE chest image from a healthy human volunteer following inhalation of HP Xe from an 800-cc Tedlar bag containing a mixture of HP Xe (86%-enriched 129Xe) : 35% N2, 65 : 35. Subject performed two respiration cycles (total lung capacity to functional residual capacity), inhaled from bag, and then took a small gulp of air (to help push HP Xe out of the trachea); TE/TR, 1.12/11 ms (specific absorption rate-limited); tipping angle, 6°; 80 × 80 × 14; acquisition time, 4.5 s; FOV, 320 × 320 × 196 mm3; 2 × 2 × 14 mm3 digital resolution after zero-filling (SNR ~8–15)[5b] b) Left: HP 129Xe spectrum from the brain of a healthy human subject following inhalation of HP Xe from a 1 L Tedlar bag containing Xe : N2 gas mixture (85 : 15 by volume) (129Xe enrichment: 87%; PXe~60%). Tentative assignment: 214.5 ppm: red blood cells (RBCs); 198 ppm: blood plasma; 195.3 ppm: grey matter; 192.5 ppm: white matter; 187 ppm: lipid (15 scans; TR=2 s; pulse tipping angle: ~55–65º). Right: sagittal 129Xe MR image (false color) of a healthy human subject overlayed on a corresponding greyscale 1H image following inhalation of HP Xe (same as above, but 100% Xe in bag). 129Xe image shows the signal from the Xe/RBC resonance alone (214.5±0.5 ppm; 2D pulse-acquire; 8X8 matrix of FIDs (zero-filled to 32×32) with 256 points; FOV = 30 cm; slice thickness = 20 cm; pulse tipping angle: ~20º; TR=0.3 s; total 129Xe imaging time: ~20 s). Figures generously provided by Madhwesha Rao, U. Sheffield, UK.[79] c) Representative examples of 3D single-time-point Magnetic Resonance Spectroscopic Imaging (MRSI) data of three prostate cancer subjects after IV injection of HP 1-13C-pyruvate.[27] The axial T2-weighted images and false-color overlays of hyperpolarized 1-13C-lactate/1-13C-pyruvate ratio are from the three patients labeled as B, C, and D. All three of the patients had biopsy-proven Gleason grade 3 + 3 prostate cancer and received the highest dose of hyperpolarized 1-13C-pyruvate (0.43 ml/kg). Patients B, C, and D had current PSAs of 5.1, 9.8, and 1.9 ng/ml, respectively. The SNR and metabolite ratios in the regions highlighted in color on the image overlays are given in Table 2 of Ref. [27] From S. J. Nelson, et al., Sci. Transl. Med. 2013, 5, 198ra108. Reprinted with permission from AAAS.

