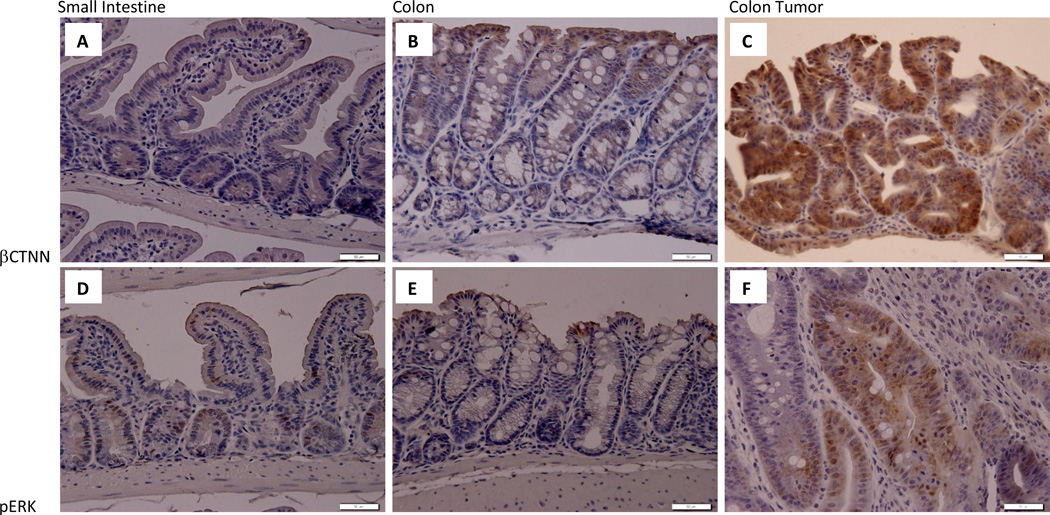
Figure 4. Immunohistochemical analysis of β–catenin and phosphor-ERK in Apc+/580S, Kras+/LSL, CAC+ mice.
Immunohistochemical analysis of β-catenin (A,B,C) and phospho-Erk (D,E,F) abundance in small intestine (A,D), colon (B,E) and colon tumor (C,F) tissues. Images taken under 400× magnification. Scale bars are 50µM.

