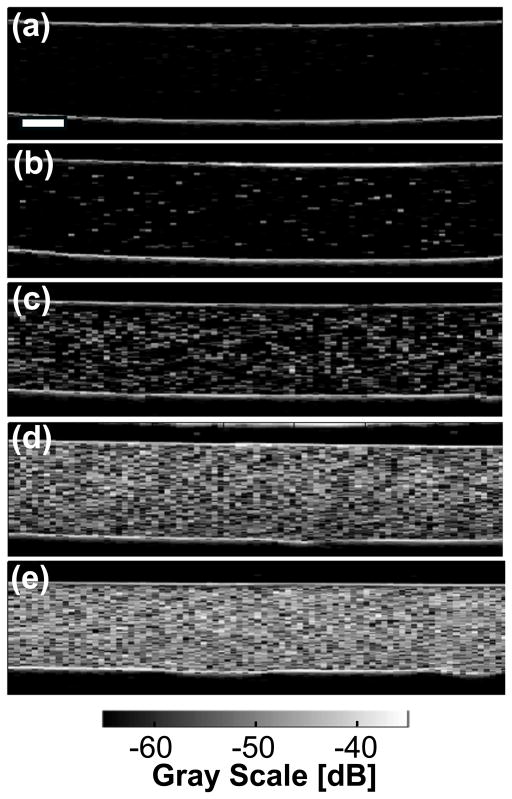
Figure 4.
Representative B-scan images of agarose gels (a) without cells, and with cells at concentrations of (b) 1×10⁴, (c) 1×10⁵, (d) 5×10⁵, and (e) 1×10⁶ cells mL−1. Data were acquired using the 38-MHz transducer. Echogenicity of the cell-embedded agarose layer increased with increasing cell concentration. Scale bar, 1 mm.

