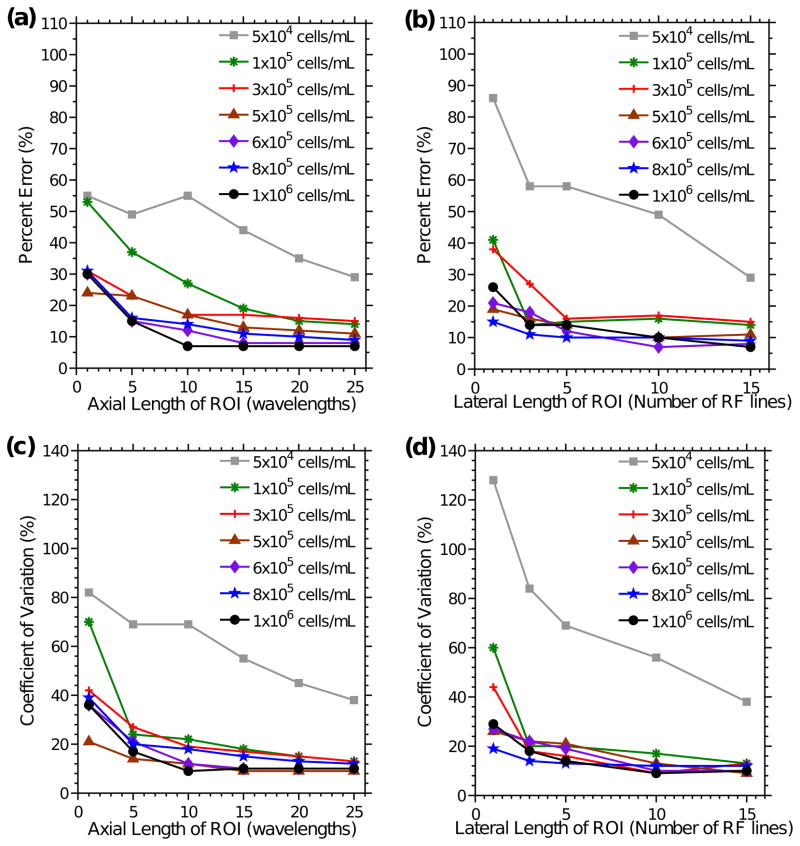
Figure 6.
Accuracy and precision of cell concentration estimates as a function of ROI dimension. Percent error of cell concentration estimates versus (a) the axial length of the ROI (when 15 RF lines were averaged) and (b) the number of RF lines (when the axial length of the ROI was 25 wavelengths) were determined. CVs of cell concentration estimates as a function of (c) the axial length of the ROI (when the lateral length of the ROI was 15 RF lines) and (d) the lateral length of the ROI (when the axial length of the ROI was 25 wavelengths) were calculated. Data were derived for cell concentrations of 5×10⁴ cells mL−1 (gray squares), 1×10⁵ cells mL−1 (green asterisks), 3×10⁵ cells mL−1 (red crosses), 5×10⁵ cells mL−1 (brown triangles), 6×10⁵ cells mL−1 (purple diamonds), 8×10⁵ cells mL−1 (blue stars), and 1×10⁶ cells mL−1 (black circles). Data were acquired using the 38-MHz transducer. Percent errors and CVs were estimated for 5 ROIs of a representative imaging plane for each cell concentration.

