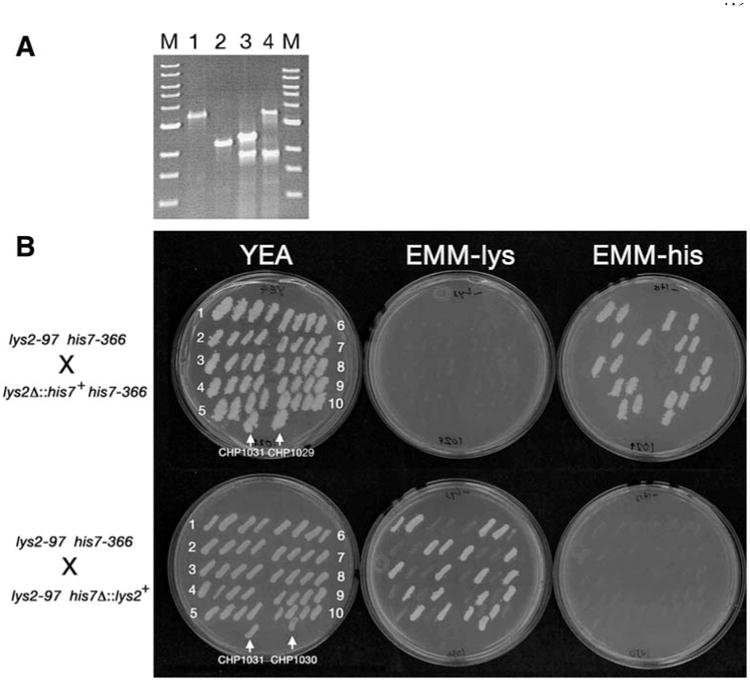
Fig. 3.

PCR-based gene disruptions using lys2+ and his7+ markers. a PCR analysis of the lys2+ (Lanes 1 and 2) and his7+ (Lanes 3 and 4) loci from strains FWP58 (lys2+; Lane 1), CHP1029 (lys2Δ∷his7+; Lane 2), CHP1028 (his7+; Lane 3), and CHP1030 (his7Δ∷lys2+; Lane 4). Lanes marked M contain a 1 kb ladder size marker. b Tetrad analysis of strains CHP1029 (lys2Δ∷his7+) and CHP1030 (his7Δ∷lys2+) crossed with CHP1031. Ten tetrads from each cross were patched onto a YEA plate and then replica plated to EMM-lys, EMM-his, and YEA. The 2:2 segregation patterns for the growth phenotype conferred by the respective selectable markers demonstrates that CHP1029 and CHP1030 each carry integration at a single genetic locus. The PCR product size in a demonstrates that a single copy of the integration cassette is present at each locus
