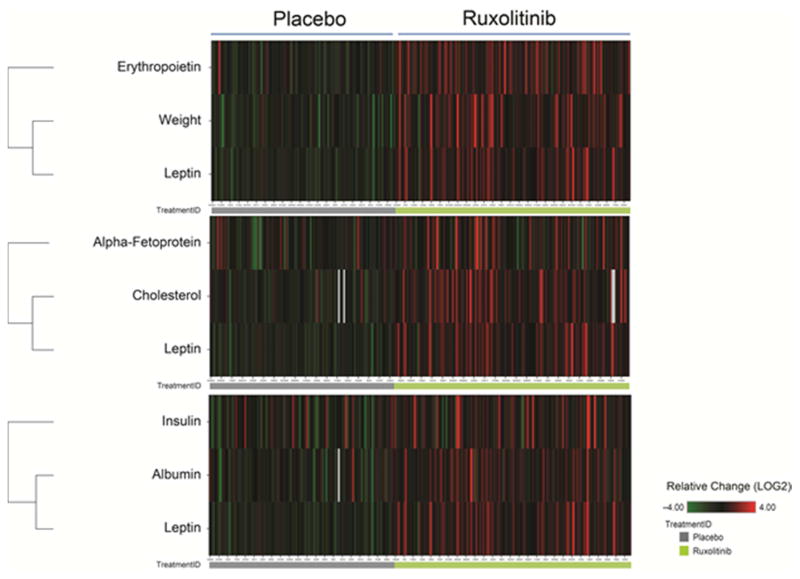
Figure 4.
Hierarchical Clustering of Plasma Markers With Changes in Weight Alone (top), Changes in Total Cholesterol Alone (middle), or Changes in Albumin Alone (bottom)
Red denotes increases at week 24 relative to baseline. Green denotes decreases at week 24 relative to baseline. Owing to differences in the magnitude of changes between markers, the heat map color intensities were normalized.

