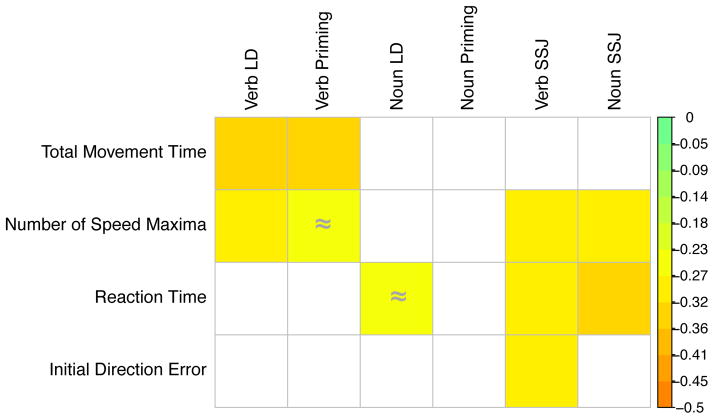
Figure 2.
Correlations between reaching action parameters and language measures. Language measures reflect differences between accuracy in action and non-action conditions. Significant (p < 0.05) values are colored (except ≈ indicates trends (p < 0.1)). The legend shows colors corresponding to the negative correlation values (from 0 to −0.50).

