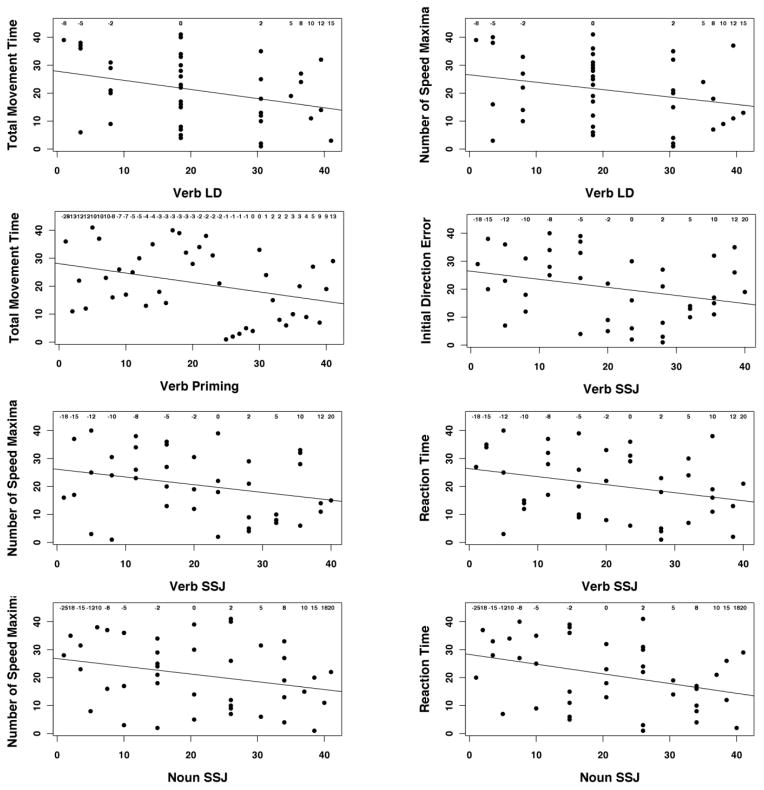
Figure 3.
Scatterplots for significant correlations between motor and language tasks with the regression line. The x-axis shows the subject rank (1–41) in the language task, while the y-axis shows the subject rank in a reaching task parameter (as rank correlation was used in the analysis). The numbers near the top show the actual difference scores from the language task. Negative numbers indicate relatively greater impairment for the action condition, while positive numbers indicate lower accuracy for the abstract condition. For reaching parameters, lower rank indicates better performance.

