
Figure 1.
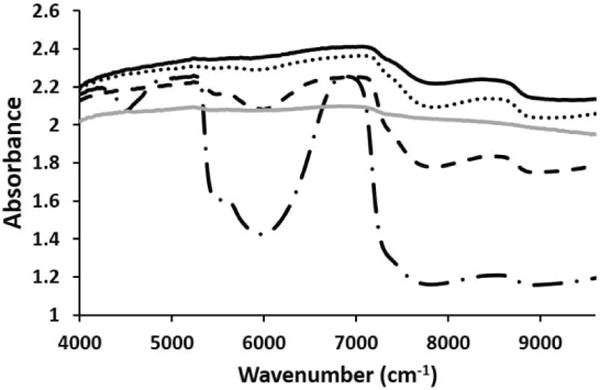
NIR cartilage spectra from 1 mm (long dash dot), 2 mm (black dash), 3 mm (dots) and 4 mm (solid black) thick samples. A diffuse reflectance spectrum (solid grey) obtained from a 1 mm thick cartilage sample on a dark surface is added for comparison of transflectance (long dash dot) to diffuse reflectance in the thin sample