
Figure 7.
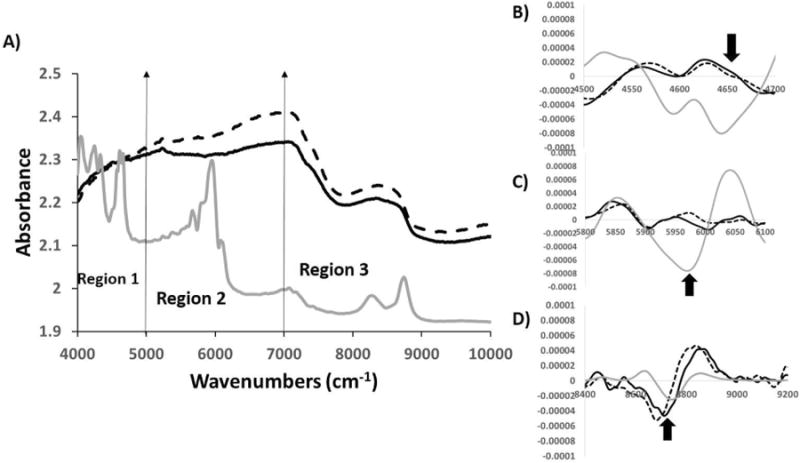
A) Comparison of raw NIR spectra from 4 mm thick cartilage with polystyrene (solid black) and without polystyrene (dotted black) along with polystyrene spectra (solid grey). Second derivatives of NIR spectra from 4 mm thick cartilage with polystyrene (solid black) and without polystyrene (dotted black) along with polystyrene spectra (solid grey) compared in region1 (B), region 2(C) and region 3(D). The polystyrene spectrum was divided by a factor of 10 to bring all spectra on the same scale.