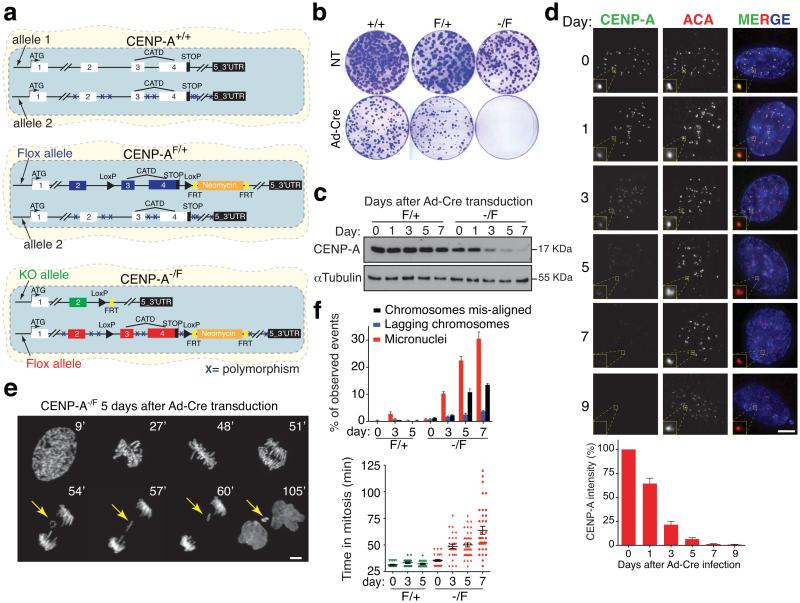
Figure 1.
CENP-A conditional disruption in human cells. (a) Schematic illustration of the final CENP-A cell lines after gene targeting. Positions of the exons, the CATD domain, LoxP sites, FRT sites, the Neomycin cassette and the start-stop codons are indicated. Xs indicate polymorphic mutations between the initial two CENP-A alleles. (b) Clonogenic cell survival assays (visualized with crystal violet) for the indicated cell lines with (Ad-Cre) or without (NT, not treated) treatment. (c) CENP-A protein level is determined by immuno-blotting extracts from CENP-AF/+ and CENP-A−/F cells at the indicated days after Ad-Cre addition. (d) Representative fluorescence images of CENP-A localization and intensity at the indicated days after Ad-Cre addition. (Bottom) Quantification of CENP-A protein levels from fluorescence images. Bars represent the mean of six independent experiments (> 30 cells per experiment). Error bars represent the SEM (standard error of the mean). ACA (anti-centromere antibody) staining was used to identify centromeres. (e) Time-lapse images of CENP-A−/F RPE1 cells stably expressing histone H2B-mRFP 5 days after Ad-Cre addition. Time (in minutes) after nuclear envelope breakdown (NEBD) is shown at the top. Yellow arrows point to a lagging chromosome that ultimately forms a micronucleus. (f) Bars represent the mean of > 50 cells per condition. Each individual point represents a single cell. Error bars represent the SEM of three independent experiments. Time in mitosis was defined as the period from NEBD to chromosome decondensation. Uncropped image of blots are shown in Supplementary fig. S7. Scale bar = 5 μm.

