Figure 4.
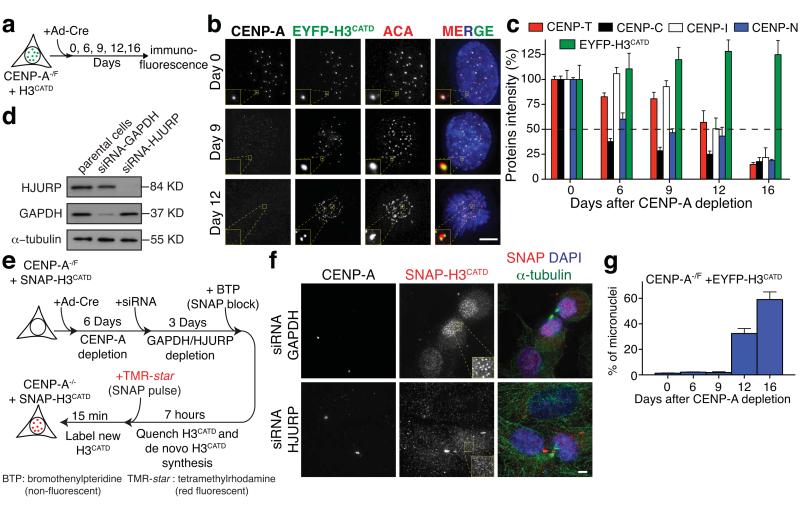
The H3CATD is sufficient for centromere identity and to template its chromatin replication. (a) Representing schematic of experimental design in (b). (b) Representative fluorescence images of the localization and intensity of endogenous CENP-A and EYFP-H3CATD at day 0, 9 and 12 after Ad-Cre addition. ACA staining was used to identify centromeres. (c) Bar graphs indicate proteins intensity at centromeres of CENP-C, CENP-T, CENP-I, CENP-N and EYFP-H3CATD (in b) at the indicated days after Ad-Cre treatment. Columns represent the mean of five independent experiments (> 30 cells per experiment) and error bars represent the SEM. (d) HJURP and GAPDH levels in cells with or without siRNA treatment for GAPDH or HJURP, determined by immuno-blotting. α-tubulin was used as a loading control. (e) Representing schematic of experimental design in (f). (f) Representative fluorescence images from the experiment in (e) to determine the localization and intensity of CENP-A and SNAP-H3CATD after siRNA of GAPDH or HJURP. α-tubulin staining was used to identify telophase-early G1 cells. (g) Columns are the mean of the percentage of micronuclei formation in CENP-A−/F cells rescued with EYFP-H3CATD at the indicated days after Ad-Cre addition. Error bars represent the SEM of three independent experiments (> 100 cells per experiment). Statistics source data are in supplementary table S2. Uncropped image of blots are shown in Supplementary fig. S7. Scale bar = 5 μm.

