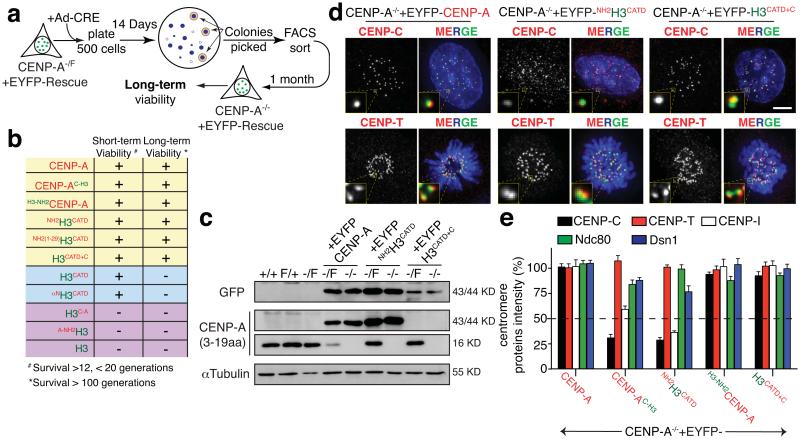
Figure 5.
The carboxyl tail of CENP-A nucleates kinetochore assembly. (a) Schematic of the long-term viability assay used to isolate survival clones after endogenous CENP-A depletion. (b) Table of viability of various CENP-A-histone H3 chimera for conferring short (12 to 19 generations) and long term (>100 generations) survival. (c) Immuno-blot to quantify levels of each EYFP-tagged rescue variant or endogenous CENP-A, visualized with GFP or CENP-A antibodies. α-tubulin was used as a loading control. (d) Representative fluorescence images show the localization and intensity of CENP-C or CENP-T in the indicated cell lines. ACA was used to mark centromeres. (e) Column graphs quantifying centromere intensities from experiments like those in (d) to measure CENP-C, CENP-T, CENP-I, Ndc80 and Dsn1 protein intensity in the indicated cell lines. Columns represent the mean of three independent experiments (> 30 cells per experiment). Error bars represent the SEM. Uncropped image of blots are shown in Supplementary fig. S7. Scale bar = 5 μm.

