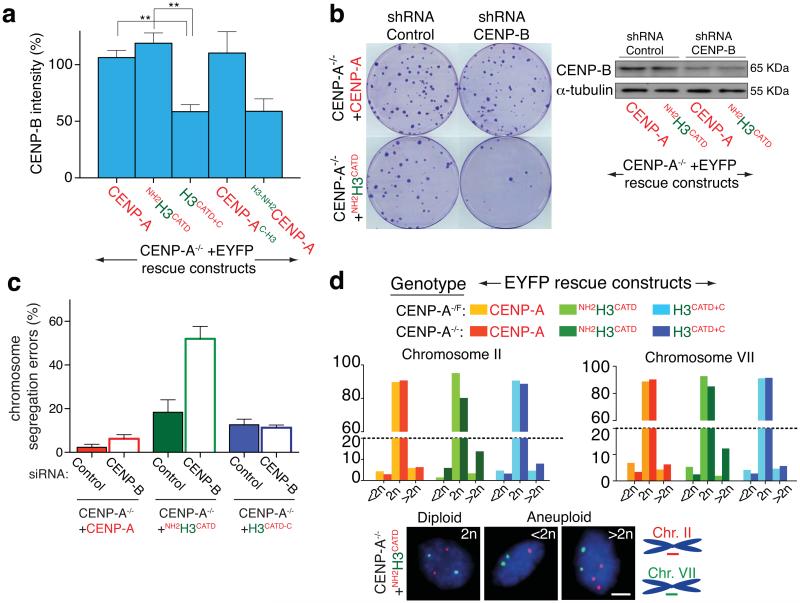
Figure 6.
The CENP-A amino terminal tail controls CENP-B levels at centromeres. (a) Column graphs represent the means of the percentage of CENP-B intensity in the indicated cell lines. Error bars represent the SEM of three independent experiments (> 30 cells per experiment. ** p < 0.006). (b) (left) Clonogenic survival assays after stable insertion to express a control shRNA (scramble) or against CENP-B. (Right) Immuno-blot of cell extracts to measure total CENP-B levels. α-tubulin was used as a loading control. (c) Percentage of cells that undergo chromosome mis-segregation after GAPDH or CENP-B depletion by siRNA in the indicated cell line. Column graphs represent the means of three independent experiments and error bars represent the SEM (d) Faithfulness of chromosome segregation after growth for 30 generations measured with Fluorescence In Situ Hybridization (FISH) for centromere regions of chromosomes 2 and 7 (CEN2 and CEN7, respectively) in the presence (CENP-A−/F) or absence (CENP-A−/−) of endogenous CENP-A. Bars represent the mean of duplicate experiments in the indicated cell line (> 100 cells per experiment). (Bottom) Diploid or aneuploid cells identified by localization of (red) CEN2 and (green) CEN7 after growth of the CENP-A−/−+NH2H3CATD cells. Statistics source data are in supplementary table S2. Uncropped image of blots are shown in Supplementary fig. S7. Scale bar = 5 μm.

