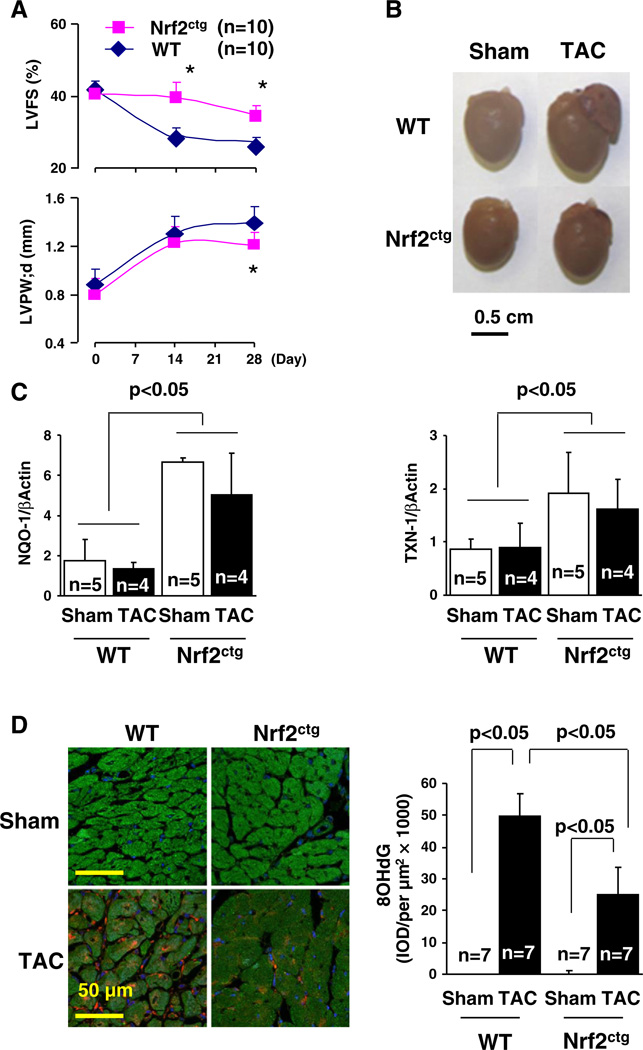
Fig. 1.
Cardiac hypertrophy and myocardial redox signaling in WT and Nrf2ctg mice after TAC. A, Time-course study of echocardiography in WT and Nrf2ctg mice after TAC. *, p < 0.05 vs. WT, n = 10. B. The representative pictures of hearts of WT and Nrf2ctg mice 4 weeks after TAC. C. qPCR analysis of NQO-1 and TXN-1 expression in the hearts of WT and Nrf2ctg mice 4 weeks after TAC. D. Staining of 8OHdG in the hearts of WT and Nrf2ctg mice 4 weeks after TAC.

