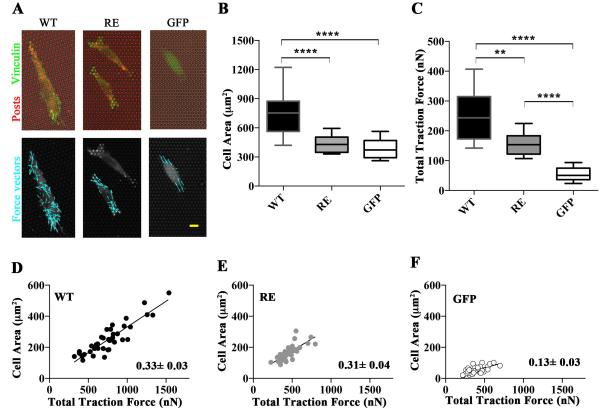
Figure 6. Cells expressing R1049E are defective in generating traction forces.
(A) Vinculin regulates traction forces. The three cell lines (vinWT, vinRE, or GFP) were seeded overnight on fibronectin-coated MPADs (posts labeled red; upper panel). GFP is visible in green (upper panel), and the cell outlines are visible (upper and lower panels). Force vectors are indicated with cyan arrows (lower panel). (B) Vinculin regulates traction forces and area. Box-whisker plots for area of cells seeded on MPAD devices (mean, 10th, 25th, 75th, and 90th percentile for cell area; >62 cells per condition). (C) Box-whisker plots for traction force generated by cells seeded on mPADs (mean, 10th, 25th, 75th, and 90th percentile for cell area; minimum 31 cells per condition). (D) Linear regression between traction force and area of WT cells with slope of the fit line shown. (E) Linear regression between traction force and area of RE cells with slope of the fit line shown. (F) Linear regression between traction force and area of GFP cells with slope of the fit line shown. In Figure 6, asterisks represent the following: ** p<0.01, **** p<0.0001; Kruskal-Wallis test.

