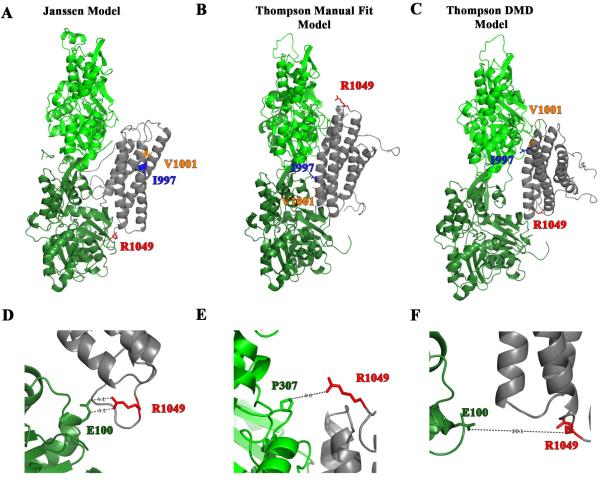
Figure 7. R1049E is a residue predicted to contact actin by the Janssen Model.
(A-C) The three different proposed models for vinculin tail (gray) binding to actin monomers (green). The I997 and V1001 residues are shown as ribbon-and-stick in blue and orange, respectively. The residue R1049 is red and represented as a ribbon-and-stick residue. The ribbon diagram in A shows the Janssen Model and was derived from PDB coordinates that were supplied by Dr. Niels Volkmann of the Burnham Institute [13]. The ribbon diagrams in B and C depict a more recent model put forth by Thompson et al. [15] and were downloaded from the Supplementary data. The models were created by Thompson et al. by manually docking the crystal structures of VT and actin filaments onto a 20 Å EM structure of vinculin bound to F-actin. The Manual Fit Model in B was manual docked using Chimera and the DMD Model in C was manual docked and then computation refinement approaches using discrete molecular dynamics (DMD) were applied. (D-E) An enlargement in the vicinity of R1049 of the above models. In the Janssen Model in Figure D, R1049 is poised 5.1 Å from E100 in one of the actin monomers suggesting the possibility that an electrostatic interaction forms. The enlargements of the Thompson Manual Fit Model in E and the Thompson DMD Model in F show that R1049 is not in close enough proximity to form electrostatic interactions. Moreover in the Manual Fit Model the nearest residue is a proline, which is not expected to form an electrostatic interaction with R1049.

