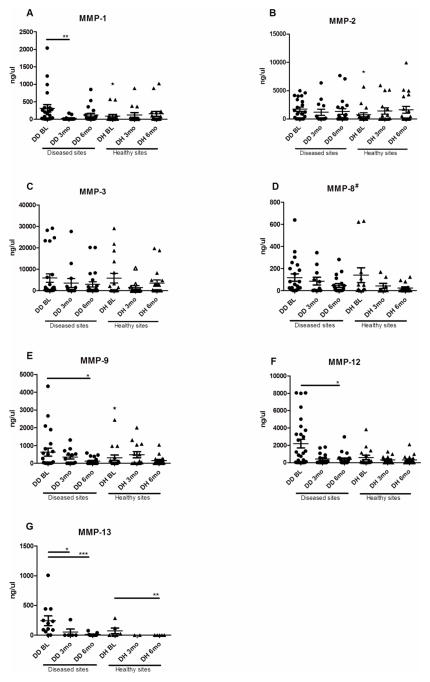
Figure 1.
(A–G). Clinical parameters at baseline and after treatment. PD>4mm = mean % of sites with PD>4mm. Mean PD sites= Mean pocket depth of sites with PD>4mm; Mean PD all= mean PD of all sites; Mean CAL= mean clinical attachment level of affected sites; BoP=bleeding on probing; PD site = mean pocket depth from diseased site sampled for GCF. Values in boxes are represented as Means (horizontal bars) ± Standard deviation (whiskers). BL= baseline (n=29); 3mo 3 months (n=16); 6mo= 6 months (n=22). Statistically significant differences* (One Way ANOVA, p<0.05) are represented as horizontal bars between timepoints by Dunn’s multiple comparisons. # indicates an overall significant difference in ANOVA on ranks.

