
FIGURE 1. TCR signal strength regulates PTEN protein levels.
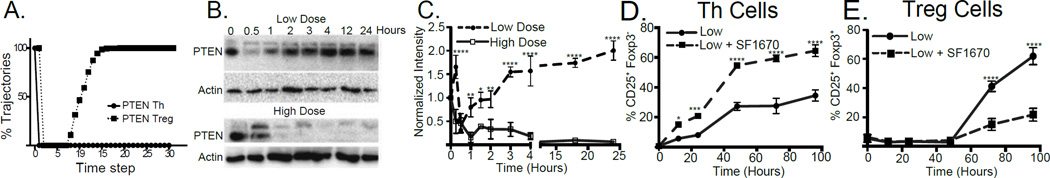
(A) PTEN activity in simulations of CD4 T cell differentiation leading to Th (solid line) and Treg fate (dotted line) reported as percentage of simulation trajectories. (B) PTEN protein levels were tracked by Western blotting of activated CD4+ T cells under low- (upper panel) and high- (bottom panel) dose conditions. (C) Actin-normalized PTEN values were plotted. D and E CD4+ T cells were activated under low dose TCR stimulation in the presence (dashed line) or absence (solid line) of a PTEN inhibitor (SF1670). The development of Th (CD25+ Foxp3−) (D) or Treg (CD25+ Foxp3+) (E) was assessed by flow cytometry on gated CD3+ CD4+ T cells. Results in C, D and E represent the mean ± SEM from 3 independent experiments.