
EXHIBIT 3. Variability In Number Of Messages Sent To Physicians Through The PatientSite Portal In 2010, By Specialty.
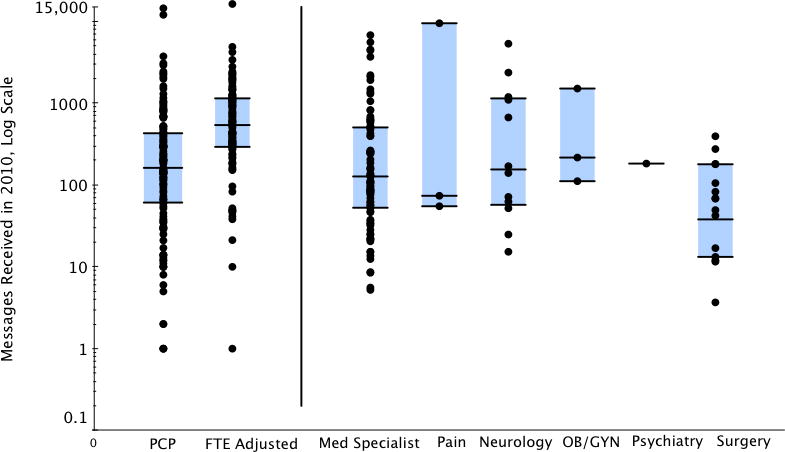
Source/Notes: SOURCE Authors’ analysis of PatientSite data and Beth Israel Deaconess Medical Center scheduling data. NOTES The center line in each shaded box represents the median, and the box represents the interquartile range (with the top line indicating the seventy-fifth percentile and the bottom line the twenty-fifth percentile). For psychiatry, only one physician used the system in 2010, and thus no interquartile range is provided. The dots indicate all observations. “FTE adjusted” represents extrapolation of message volumes that academic and other part-time primary care physicians with less than full-time clinical effort would have if they practiced full time.