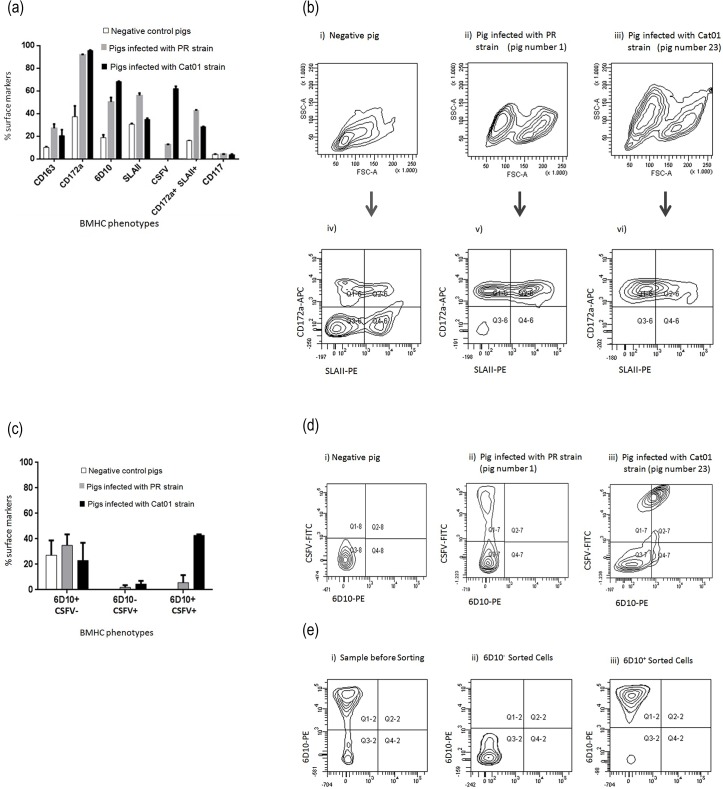
Fig 6. Expression of cellular markers and comparative phenotypes of BMHCs from PR, Cat01 and non-infected pigs.
(a) Expression of 5 different surface markers and CSFV in BMHCs from infected and non-infected pigs. (b) Comparative phenotypes of BMHCs obtained from non-infected pigs (i, iv) and pigs infected with the PR (ii, v) and Cat01 (iii, vi) strains. (i, ii and iii): forward scatter (relative cell size, x-axis) and side scatter (relative granularity, y-axis). (iv, v and vi): double labelling immunofluorescence image of the BMHCs from (i, ii and iii), in terms of CD172a common myeloid marker (y-axis) and SLA-II (x-axis). (c) Percentage of granulocyte 6D10+ and 6D10+_CSFV+ double-positive cells in the BMHCs. (d) Double labelling immunofluorescence image of the BMHCs from one non-infected and two infected pigs, in terms of 6D10, immature granulocytes marker (x-axis) and CSFV (y-axis). (e) Sorting of 6D10+ BMHCs. These experiments were repeated twice under the same conditions.

