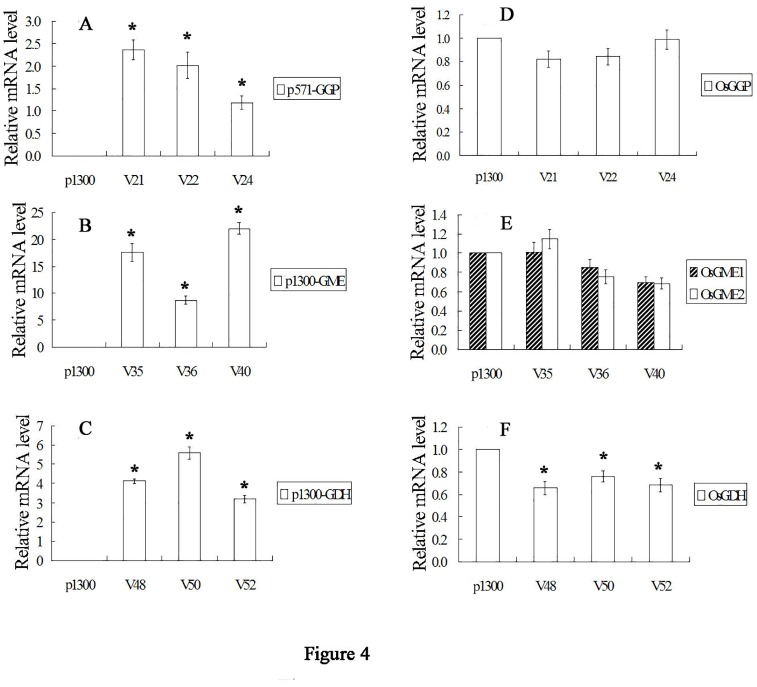
Fig 4. Relative gene expression in AtGGP, AtGME and AtGDH transgenic lines.
A, AtGGP; B, AtGME; C, AtGDH; D, OsGGP; E, OsGME1 and OsGME2; F, OsGDH. A-C, data obtained by real-time RT-PCR were normalized using actin mRNA expression. E-F, data obtained by real-time RT-RCR were normalized using actin expression and are expressed as a percentage of the control. Asterisk indicates values that are significantly different from those of empty control plants (Tukey’s test, P<0.05).

