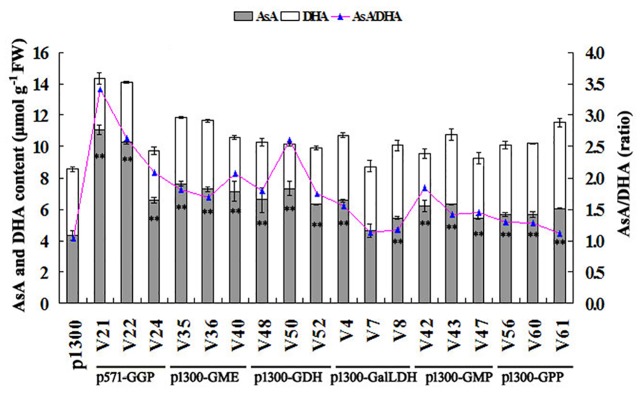
Fig 6. AsA and DHA contents and the ratio of AsA to DHA in each transgenic line.

Data are the averages of thirty plants ± standard deviation. Double asterisk indicates values of AsA content are significantly different from those of empty control plants (Tukey’s test, P<0.01).
