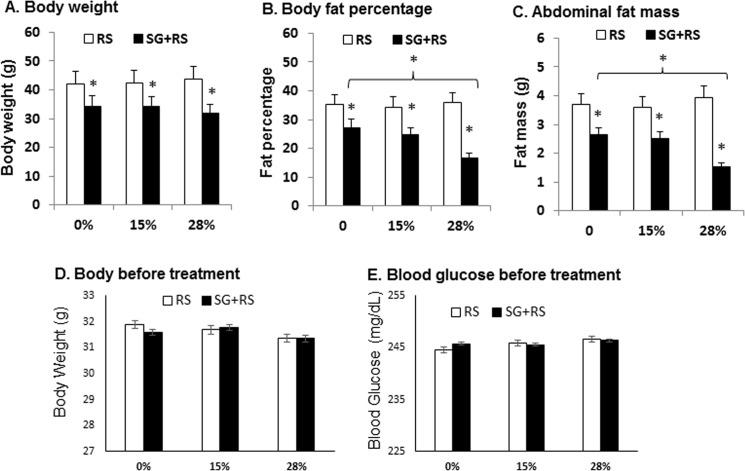
Fig 1. Body weight and adiposity.
(A) Body weight of animals in response to treatment by SG and RS. (B) Body fat content as percentage of total weight. (C) Abdominal fat mass. (D) Body weight before treatment. (E) Blood glucose before treatment by SG and RG. The results are expressed as mean ± SEM (n = 9–10). * p<0.05 versus RS alone.

