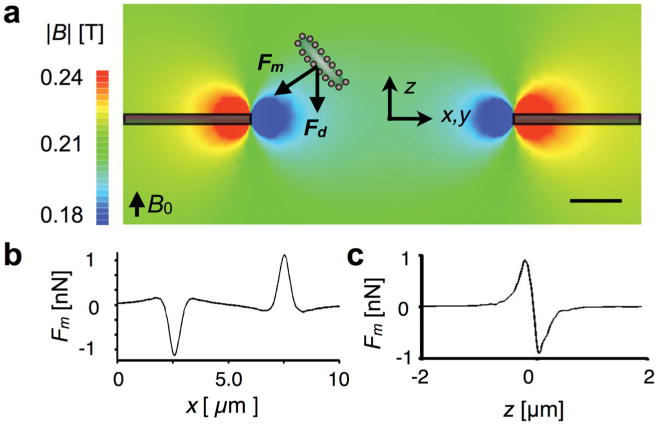
Figure 2.

Characterizing the TEMPO with finite element simulations. a) Magnetic field simulations. The magnetic field strength |B| is plotted on the cross-section of an individual d = 5 μm micropore. A magnetically labeled cell is pulled towards the edge of the TEMPO with a magnetic force Fm. To trap the cell, the magnetic force Fm must overcome the drag force Fd. The scale bar is 1 μm. b) The magnetic force on a 1 μm diameter magnetic microbead is plotted as a function of x, Δz = 500 nm above the TEMPO. The force is localized laterally within ≈2 μm of the pore's edge. c) The magnetic trapping force is plotted vs z Δx = 500 nm from the edge of the micropore. The force is localized vertically within ≈ 1 μm.
