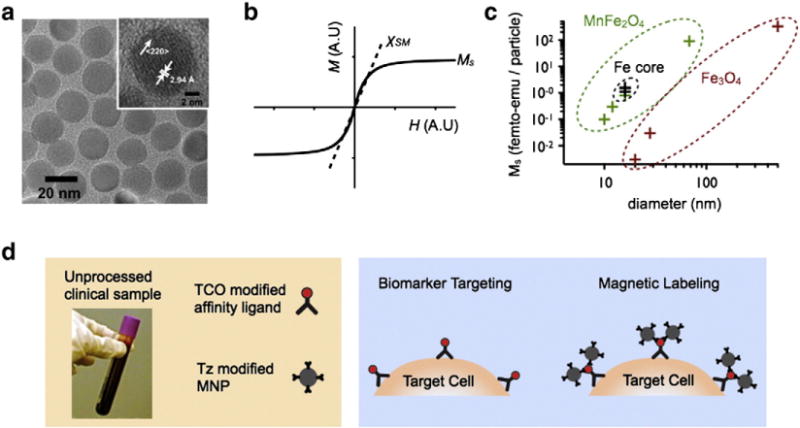
Fig. 2.

Magnetic nanoparticle labeling. a. A transmission electron micro-graph (TEM) images of manganese-doped ferrite nanoparticles (MnFe2O4) [26]. b. A graph demonstrating a typical magnetization curve for a suspension of superparamagnetic nanoparticles, with susceptibility χSM and saturation magnetization Ms. c. A graph summarizing the magnetization Ms and size of recently reported particles [5]. d. A summary of two-step magnetic labeling. First a clinical sample is mixed with a TCO modified affinity ligand (e.g. antibody), and then subsequently labeled with Tz modified MNPs.
